


In this guide, we will walk you through the fundamental steps to set up your ClientZen account and introduce you to the robust features available at your fingertips.
Create a Profile (Free Trial)
Kickstart your ClientZen journey by signing up for a free trial here. This will grant you access to explore the myriad of functionalities and understand how ClientZen can seamlessly fit into your workflow.
Sync Your preferred Feedback Source
After you have successfully created your account, the next step is to choose a feedback source that you want to connect with ClientZen.
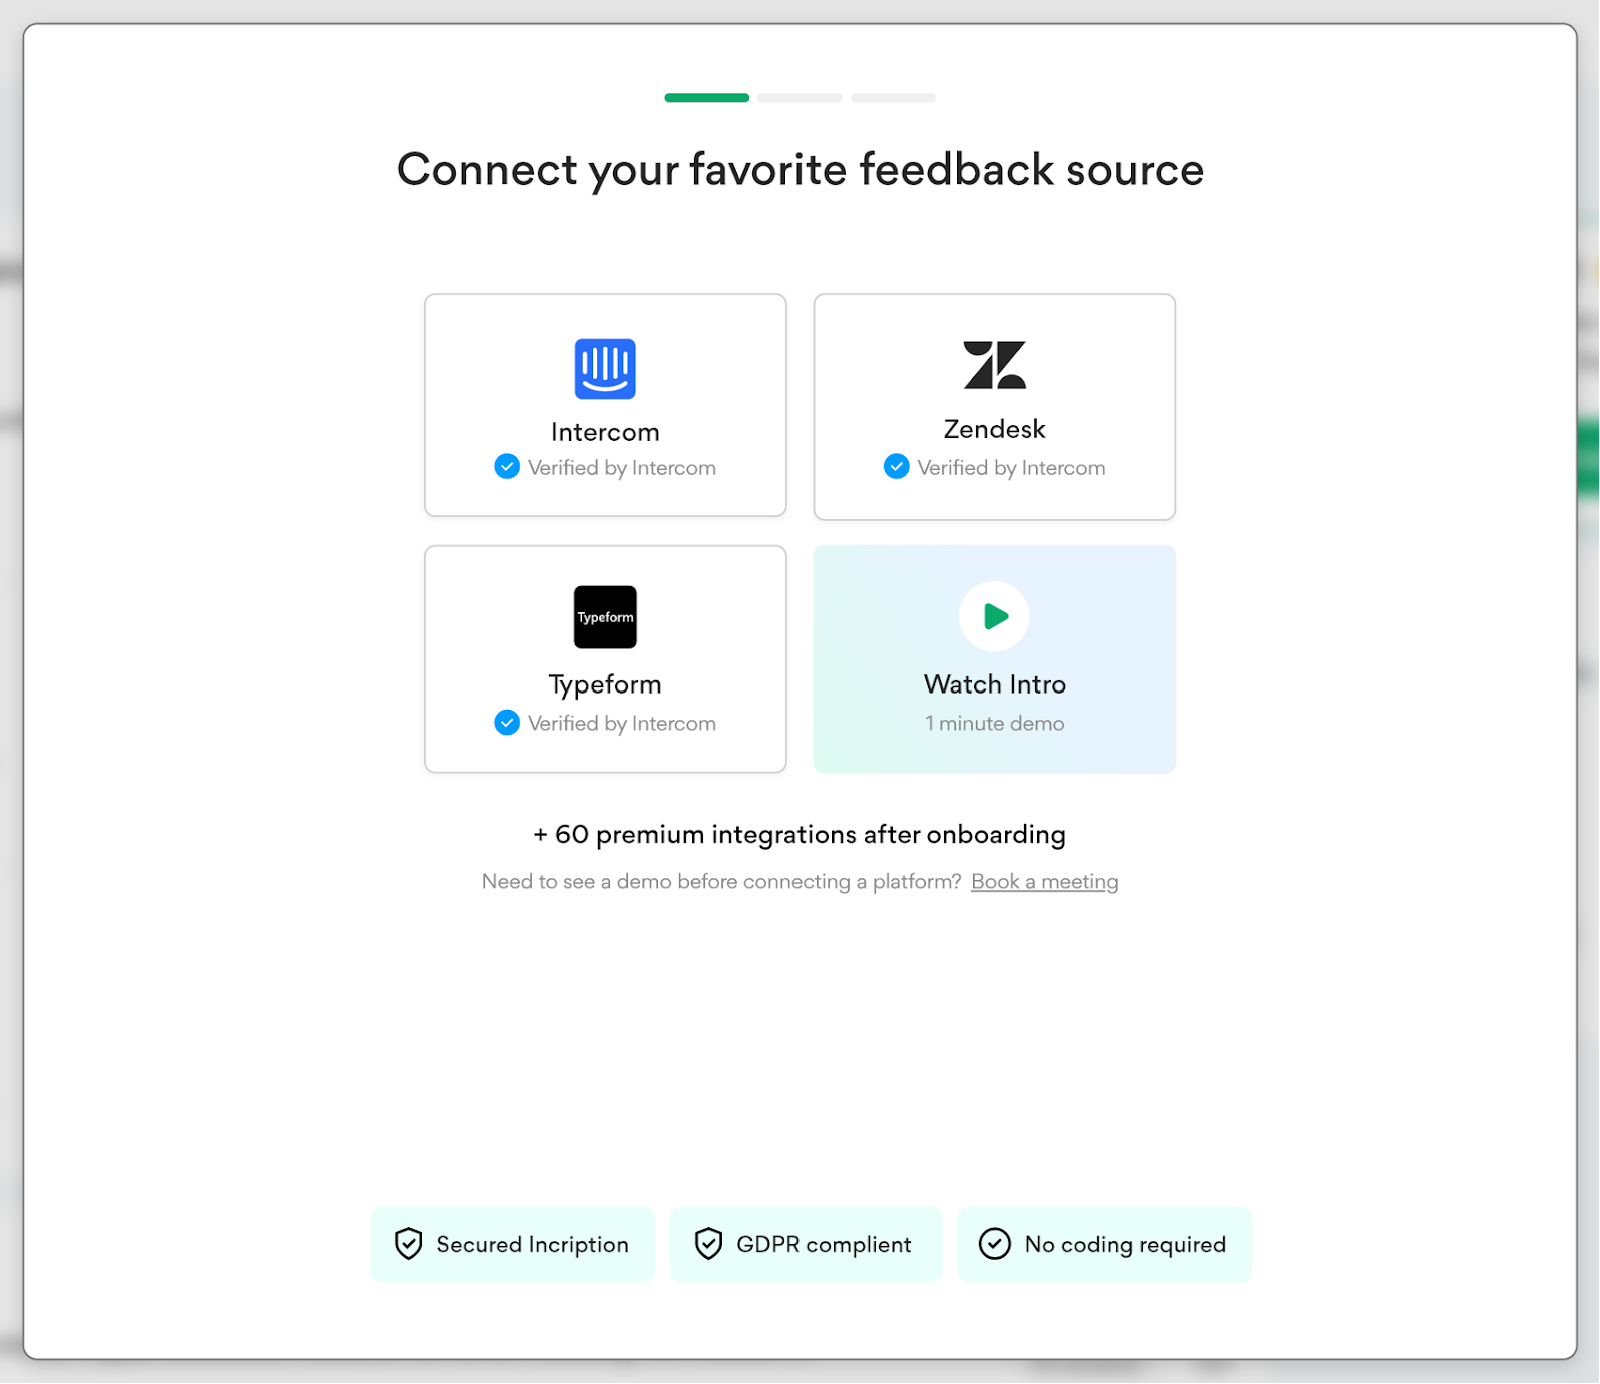
You have several choices here: If you use Zendesk, Intercom, or Typeform, you can automate the process. However, CSV file support is available only once you've set up your account, completed the onboarding process, and linked your preferred platform.
To better understand how ClientZen works, you can also check our Demo tutorial so you’ll get equipped with all the necessary knowledge before starting.
a) How to Sync Automatically
- Navigate to the 'Integrations' tab on your dashboard.
- Select your platform from the available options (Zendesk, Intercom, or Typeform).
- Follow the prompts to authorize access and synchronize your data.
- Monitoring the sync status; this will take some time, depending on the number of data that needs to be synced, but we recommend watching our demo tutorial while the data is processing.
- After the data is processed, you can see your real-time customer insights right away on our home section.
b) CSV File Upload
- Navigate to the 'Integrations' tab and choose 'CSV Upload'.
- Select your file and map the columns to the corresponding fields in ClientZen.
- Confirm the upload and observe the data integration on your dashboard.
Dashboard Overview
Home
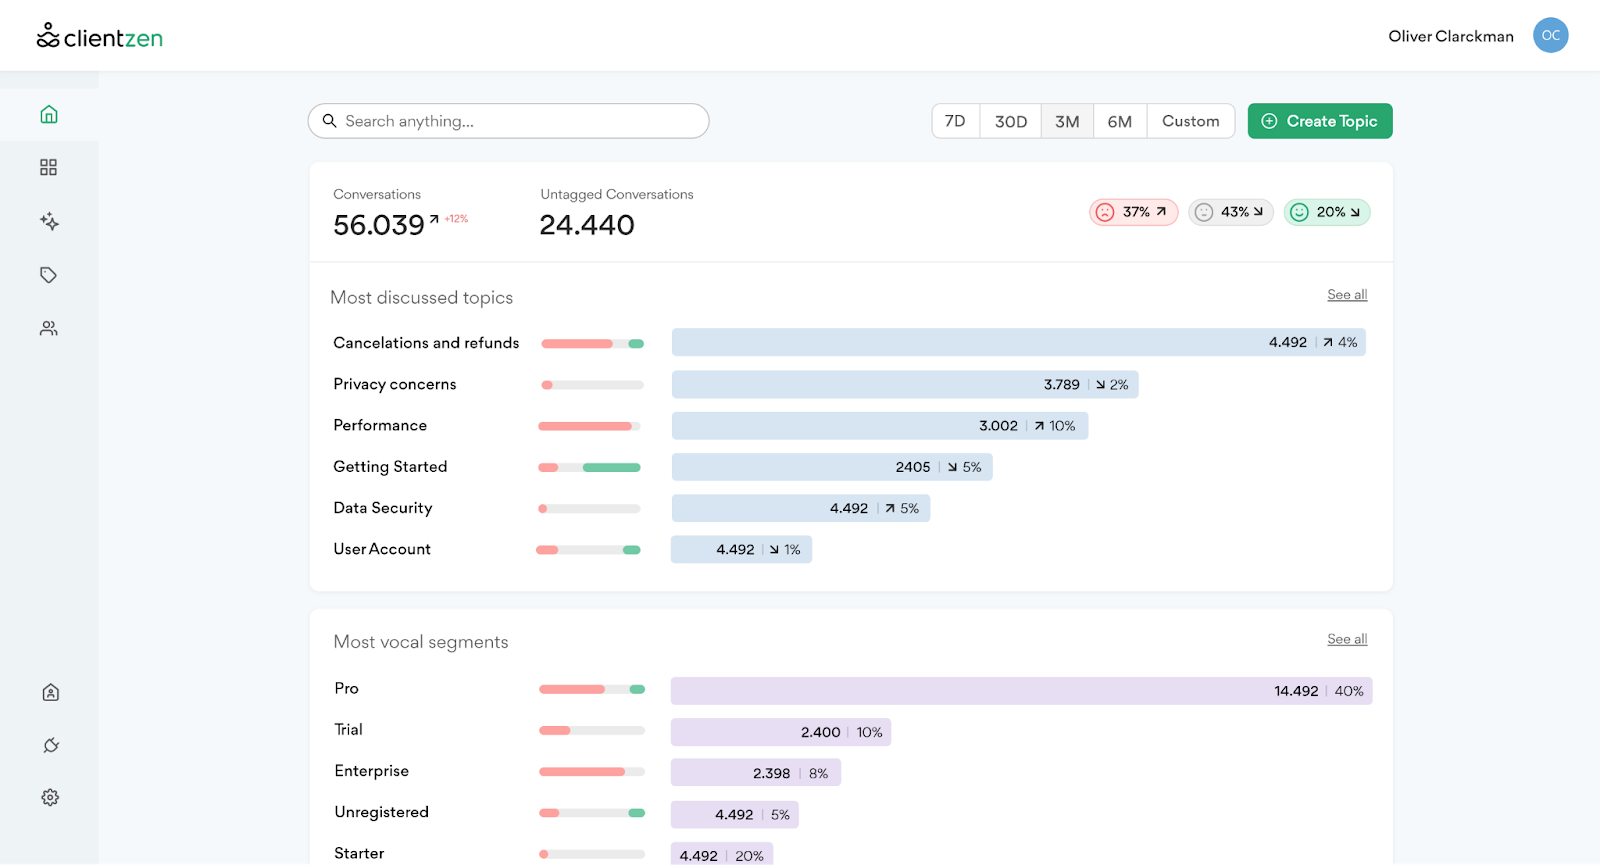
1. Metrics: Obtain a concise summary of essential performance metrics and evolving customer feedback patterns.

- 1.1 Conversations: Displays the sum of conversations you've either synced or inputted manually.
- 1.2 Untagged Conversations: This metric reveals the count of untagged conversations. Tagging conversations will help you categorize your customer insights. By tagging conversations you can structure your customer input into Topics.
- 1.3 Sentiment Overview: This utilizes sentiment analysis across all conversation layers to uncover underlying customer feelings within their messages. It's segmented into negative, neutral, and positive sentiments. Each segment offers a broad view of user sentiment regarding specific concerns, themes, or areas.
2. Most Discussed Topics: Dive deeper into the dashboard to understand frequently discussed subjects and their associated sentiments and metrics. For in-depth insights, simply select an individual topic.
3. Most Vocal Segments: Aggregate your information for a customized breakdown. Here, based on your plan, you can identify and gauge your most engaged segments.
4. Timeframe: Oversee and adjust the data you've synchronized or uploaded. By default, intervals available are: the past week, month, quarter, or half-year. Alternatively, for specific durations, choose the custom option.
Topics
To better understand your customers' voices, delve into our Topics section. Here, you'll see topics curated from conversations with your clients.
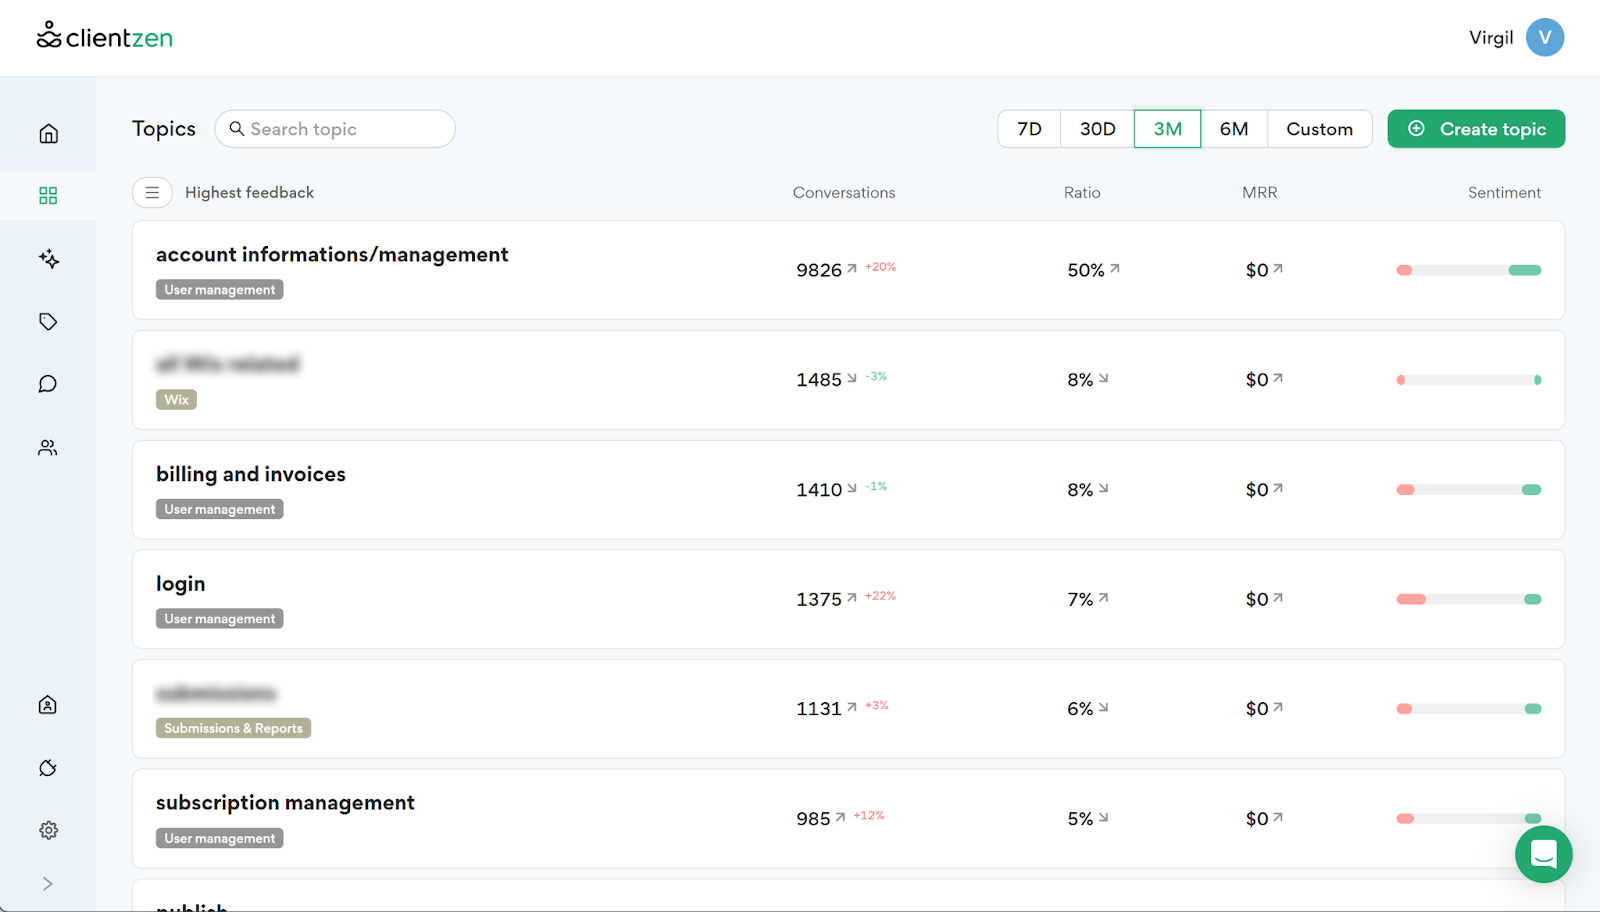
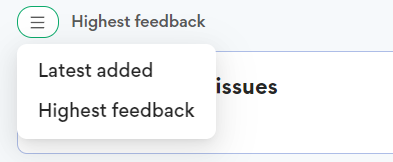
Sorting
By default, topics are organized by the frequency of related customer interactions. However, you have the flexibility to arrange these insights by either the highest feedback (set as the default) or by the most recently added conversation.
By selecting a specific topic, you’ll be redirected to your chosen topic’s dashboard.
Topic Dashboard
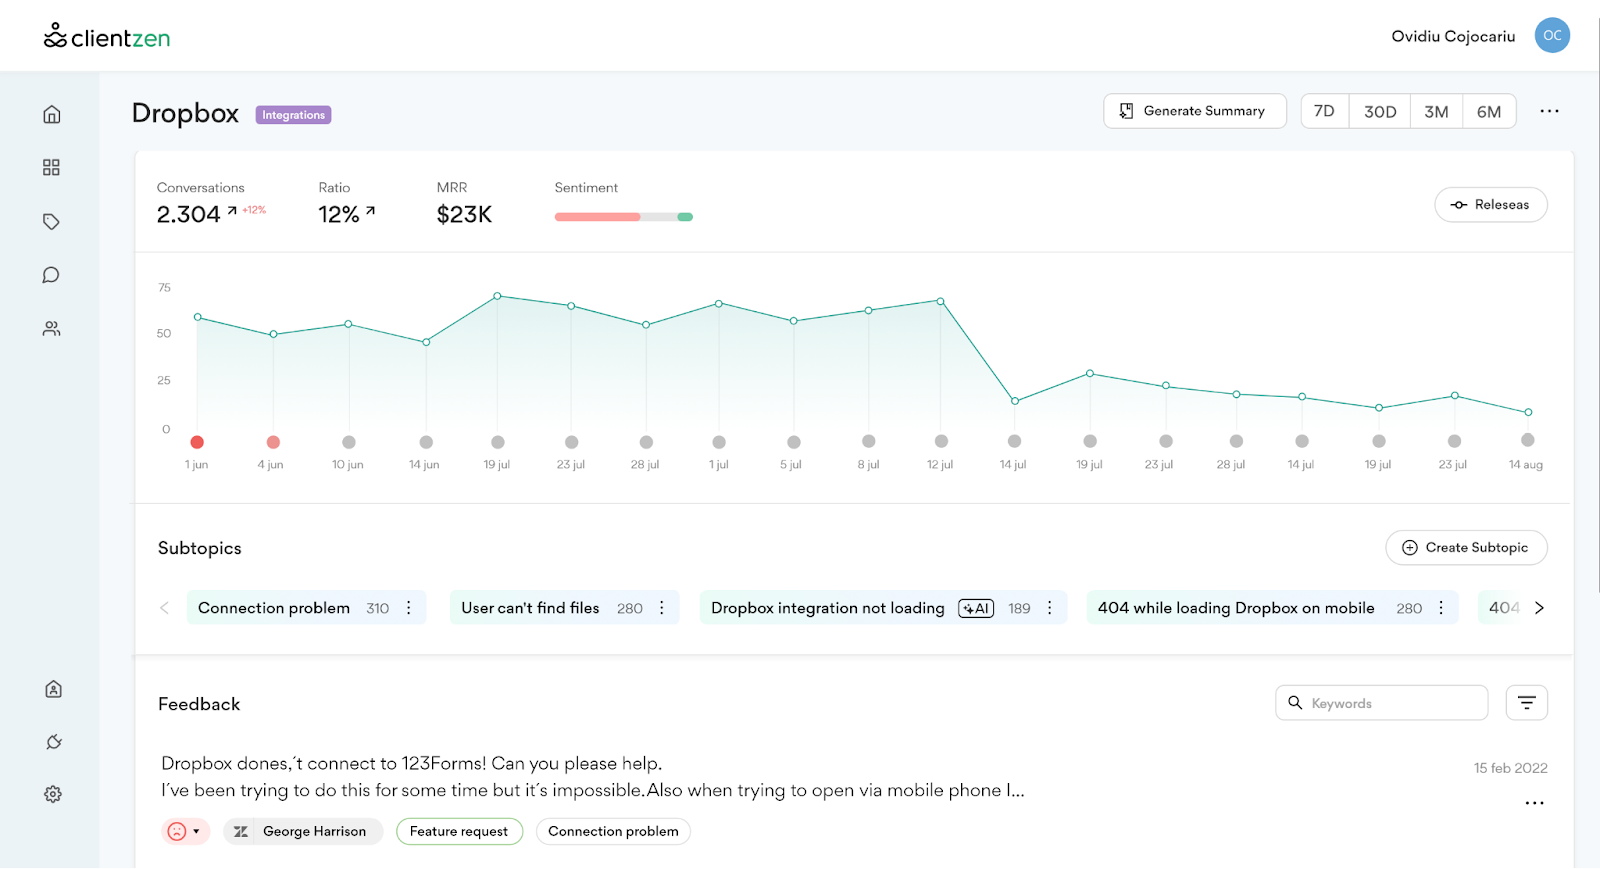
This dashboard displays statistics related to specific topics and how customer feedback has evolved over a designated timeframe for that topic. Each topic is typically linked to a category. If you don't observe a category paired with your topic, you can assign one by navigating to the category page or by selecting the topic directly and appending the suitable category.
Much like the main dashboard, metrics within your selected timeframe provide insights, including:
- Conversation - The overall conversation count.
- Ratio - The proportion of those conversations out of the total.
- MRR - representing the Monthly Recurring Revenue for the selected topic.
- Sentiment - A sentiment bar revealing underlying client feelings about the topic.
Subtopics Carousel
Each topic has multiple subtopics to provide you a granular view of your customer feedback. You’ll see 2 types of subtopics:
- Subtopics that already were assigned to your topic.
- AI suggested subtopics that are not added yet inside your topics but our Mantra AI already discovered while analyzing your clients conversations.
By clicking on a subtopic of your choice, you’ll be able to see the conversations related to your selected subtopic. Note: The trend chart will not be changed since it will still illustrate data about your main topic.
Use the release tracker to gauge the immediate effect of actions taken, such as addressing a recurring issue or introducing a new feature frequently requested by your clients. This tool allows you to pinpoint the date of your action for clearer insights. To view all your actions or fixes, simply click on "see all releases."

Summarization
To summarize discussions about a specific topic, utilize the "Generate Summary" button. Our AI will analyze all conversations from the selected topic and timeframe, providing a concise summary of all relevant discussions.

Discovery
The purpose of Discovery is to swiftly and comprehensively uncover customer challenges. It's designed to conserve your time, which otherwise might be spent categorizing customer feedback. Our Mantra AI efficiently identifies patterns in client feedback, presenting potential topics for organizing your data.
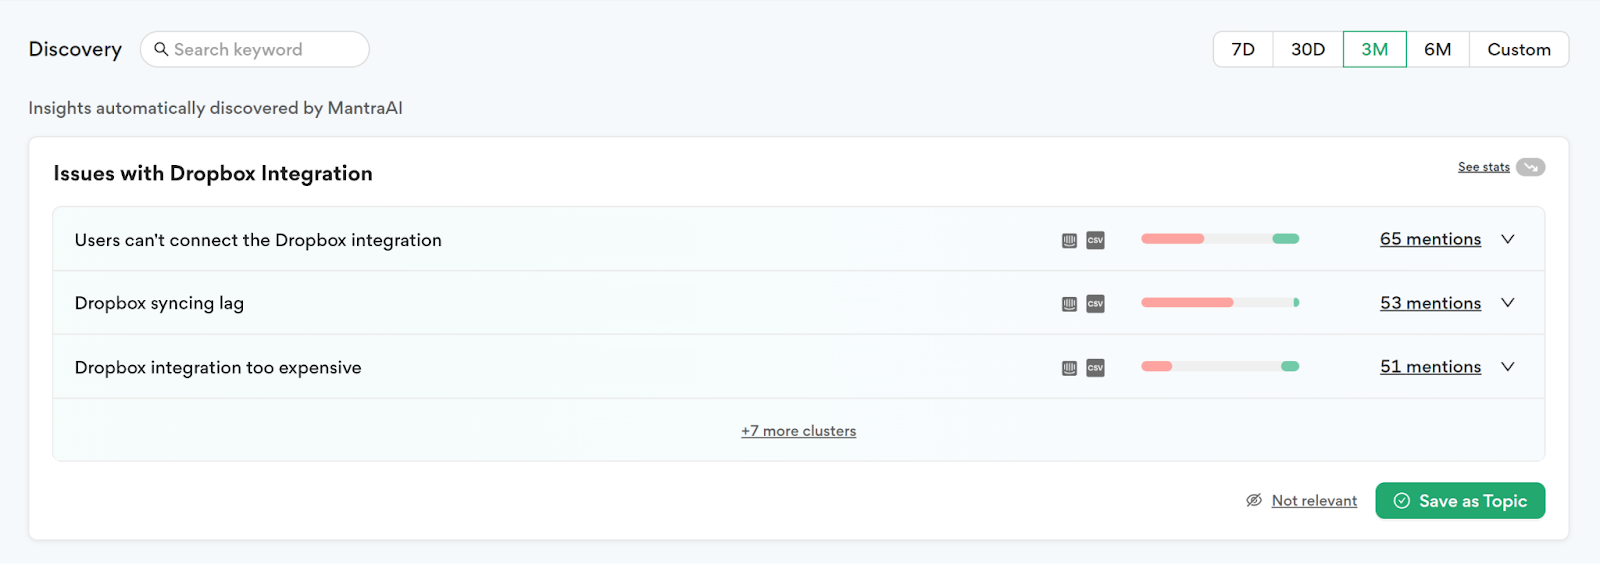
Feedback is grouped into clusters, with each cluster corresponding to a topic. You can gain insights about a suggested topic by hovering over the stats icon in the top right corner. Feel free to adopt the recommended topic as a new One or dismiss it as non-relevant if it doesn't align with your focus.
Categories
Every Topic falls under a Category. Using Categories allows for a broader perspective on customer data, enabling you to view information from a higher vantage point.
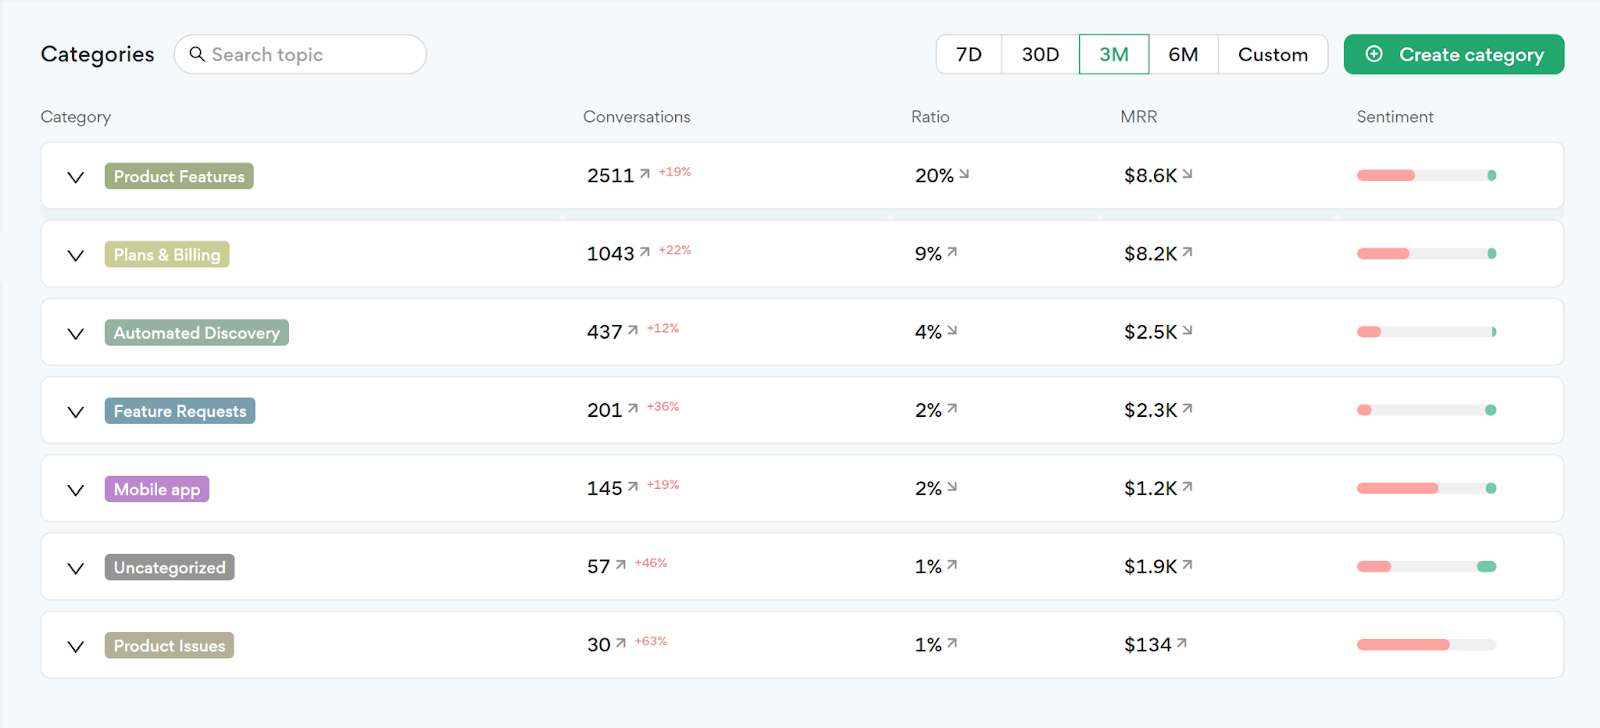
Select a desired Category from the dropdown, and you'll be presented with all the Topics linked to that category. To delve deeper into specific data, simply click on a Topic, and you'll be directed to its dedicated page.
Conversations
This dashboard provides a comprehensive view of all your customer interactions.
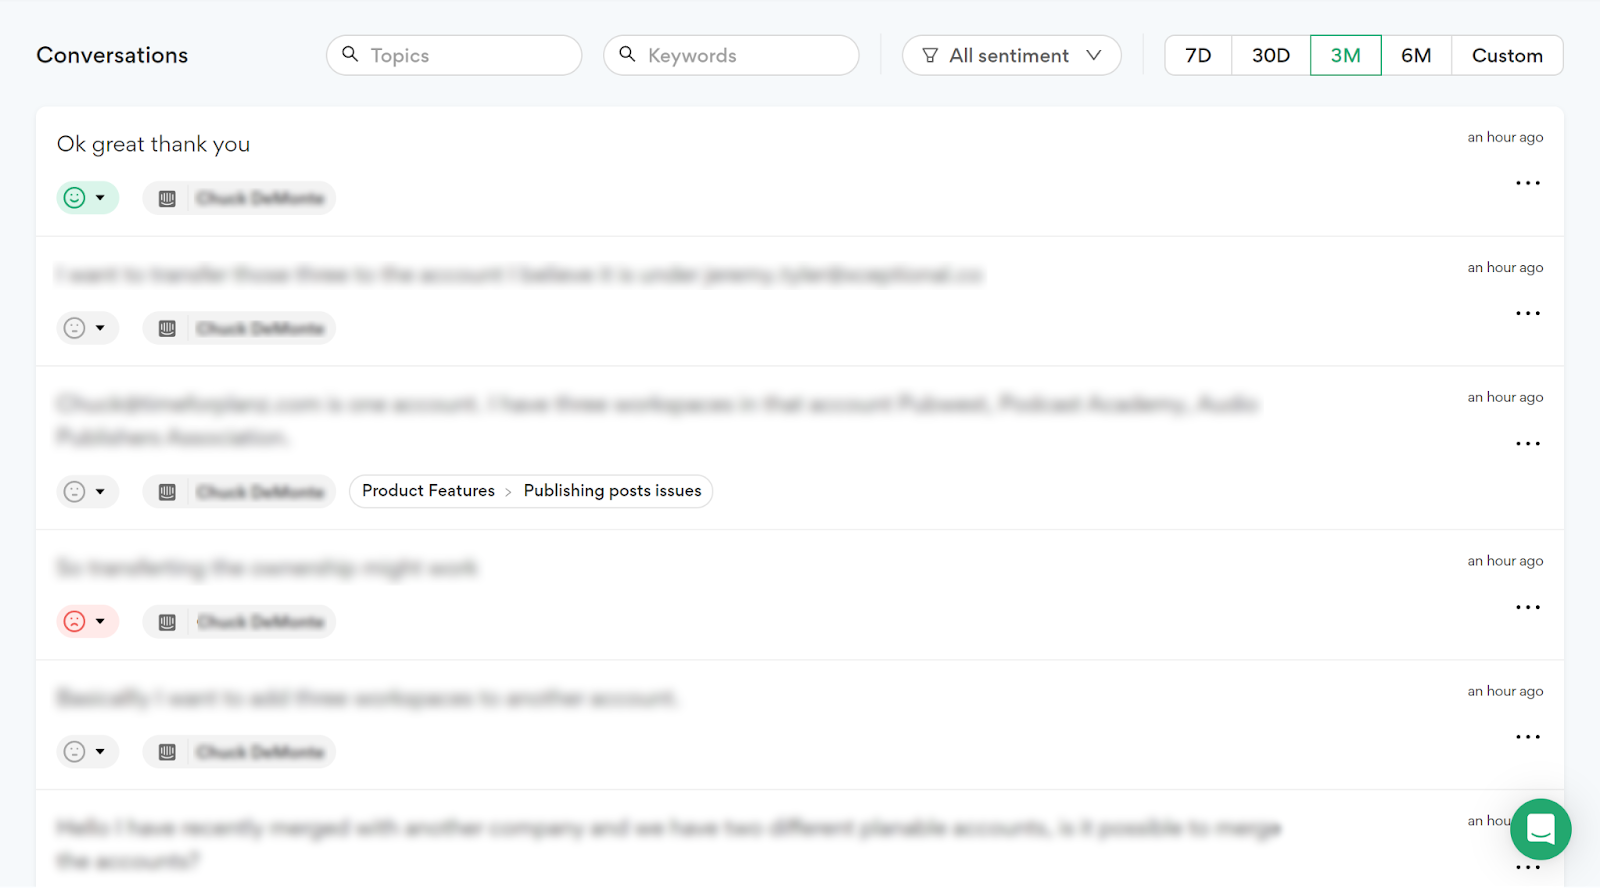
Utilize the Topic search for a streamlined lookup of conversations pertaining to a specific topic, or select keyword search to pinpoint desired discussions. Our filter feature allows you to organize conversations by sentiment: positive, neutral, or negative.
People
When you select "People," you'll be presented with a comprehensive list of your customers. You have the option to organize this list by various criteria including the number of conversations, MRR, Topics, Renewal stage, User type, or sentiment.

If you wish to export the data, simply click on "Export to CSV." Shortly after, your desired CSV file will be prepared and ready for download.
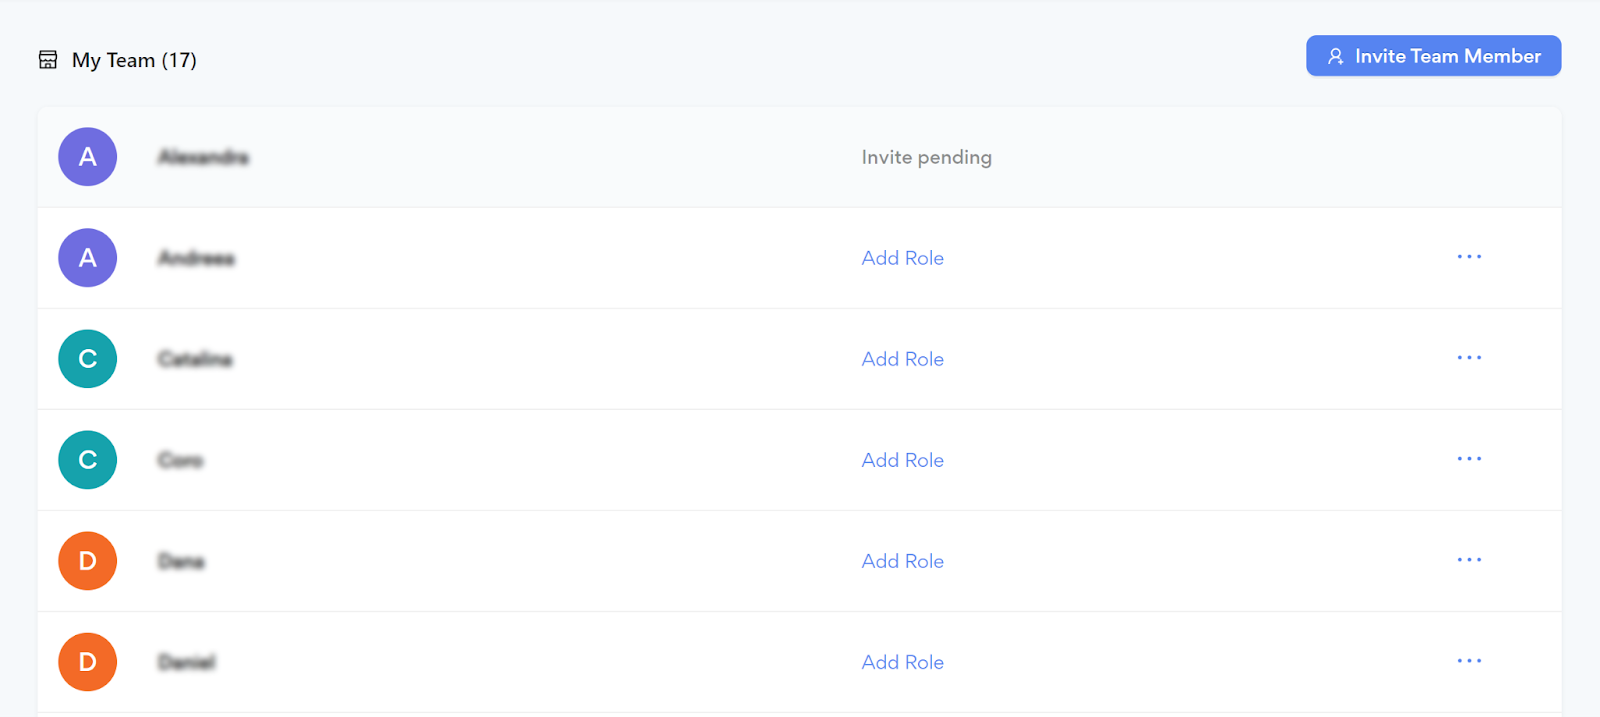
Team
You have the flexibility to modify or add team members as per your needs. Adjust their designated roles or remove accounts that are no longer active.
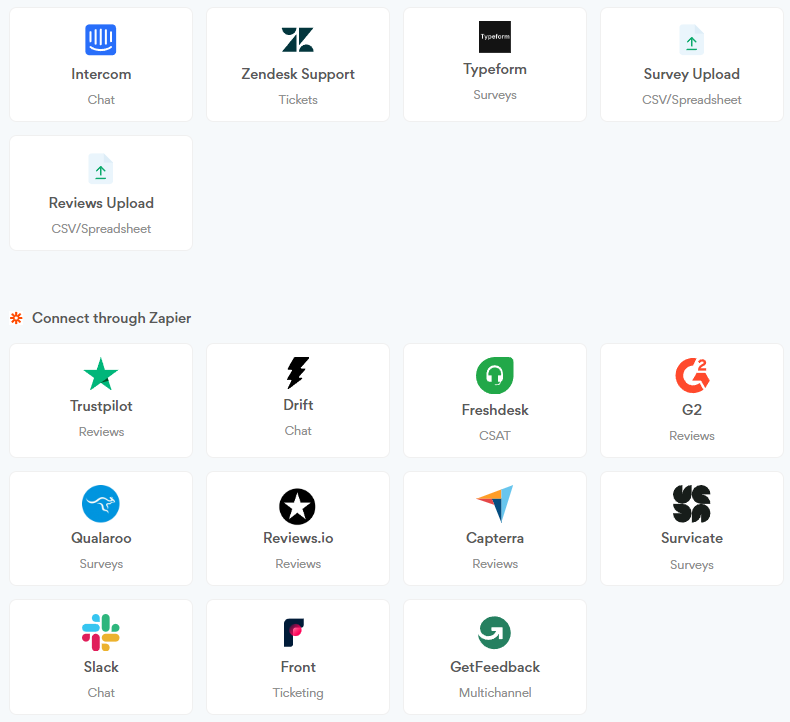
Integrations
If you haven't connected a platform yet or are looking to expand your channels, simply click on "Integrations". From there, choose your preferred platform and within a few steps, effortlessly sync various data sources.
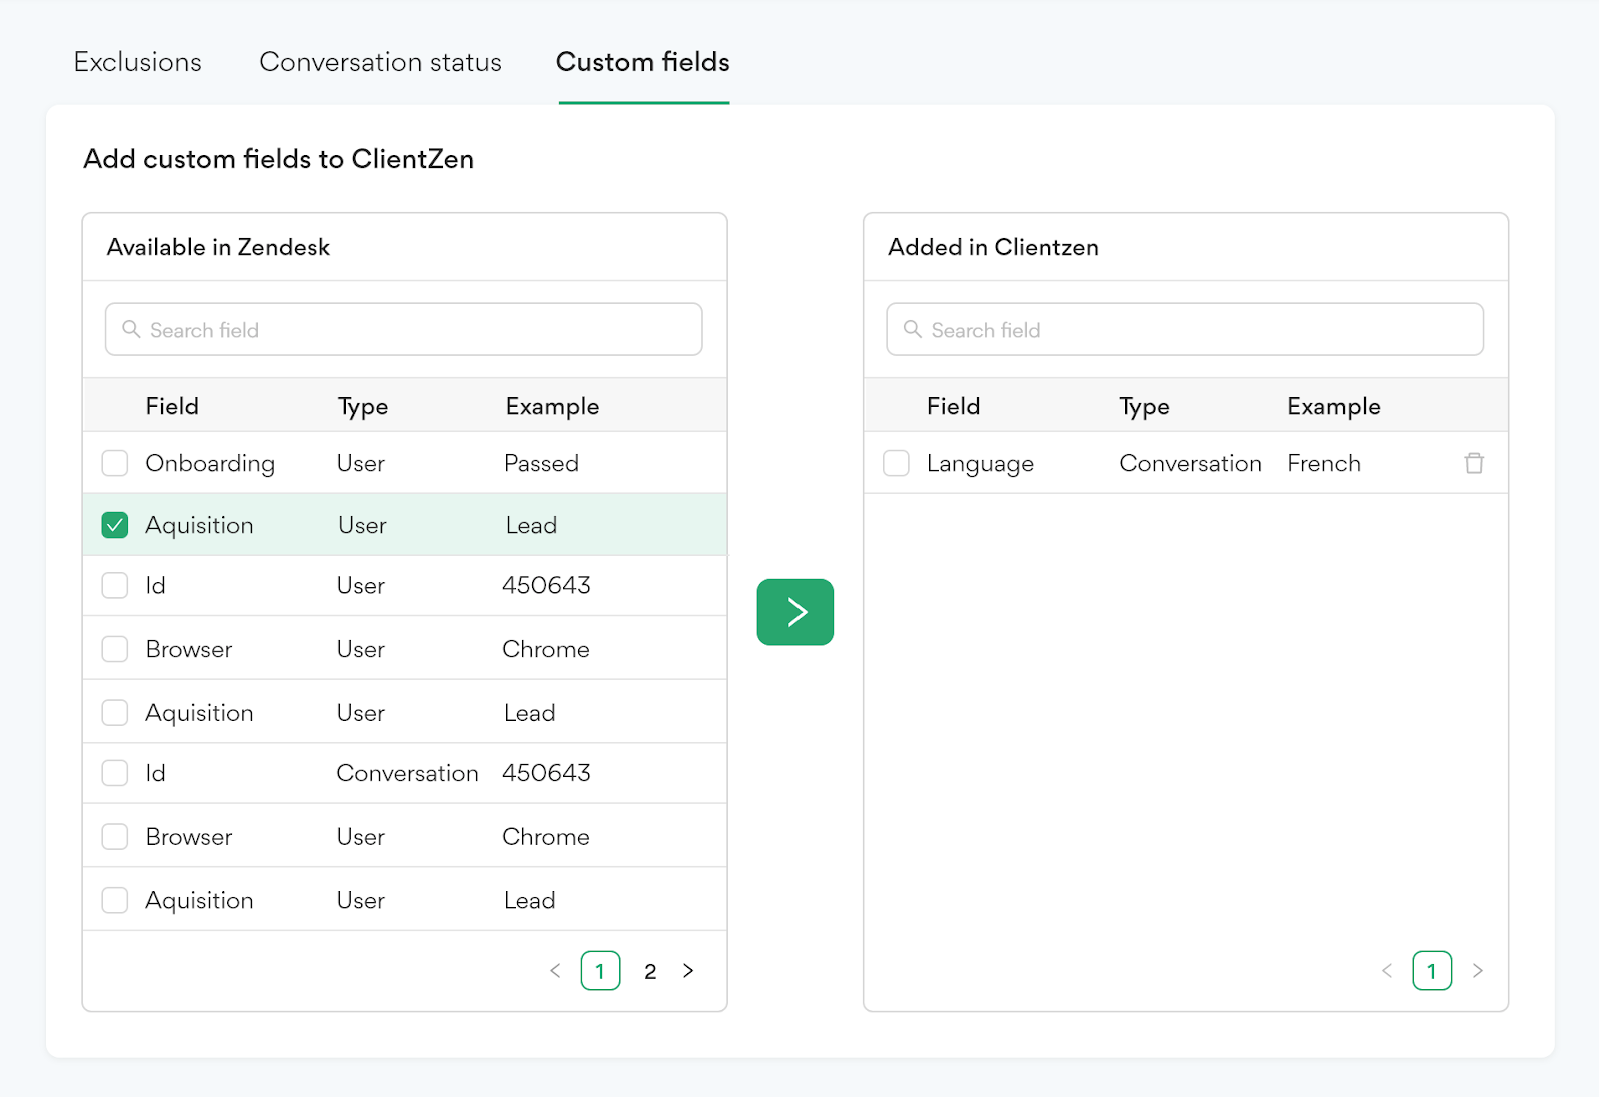
Settings
To adjust any account-related preferences, navigate to the settings where you can customize based on your needs.
For instance, you have the option to exclude certain individuals from customer feedback analysis or activate conversation marking for recent interactions.
Utilize custom fields to align your data from your chosen platform. We're actively enhancing our custom fields to allow you to incorporate even more details from your customer information.
Customer feedback made easy

Customer feedback tagged automatically
Real-time customer sentiment scores
Pain-points evolution over time


